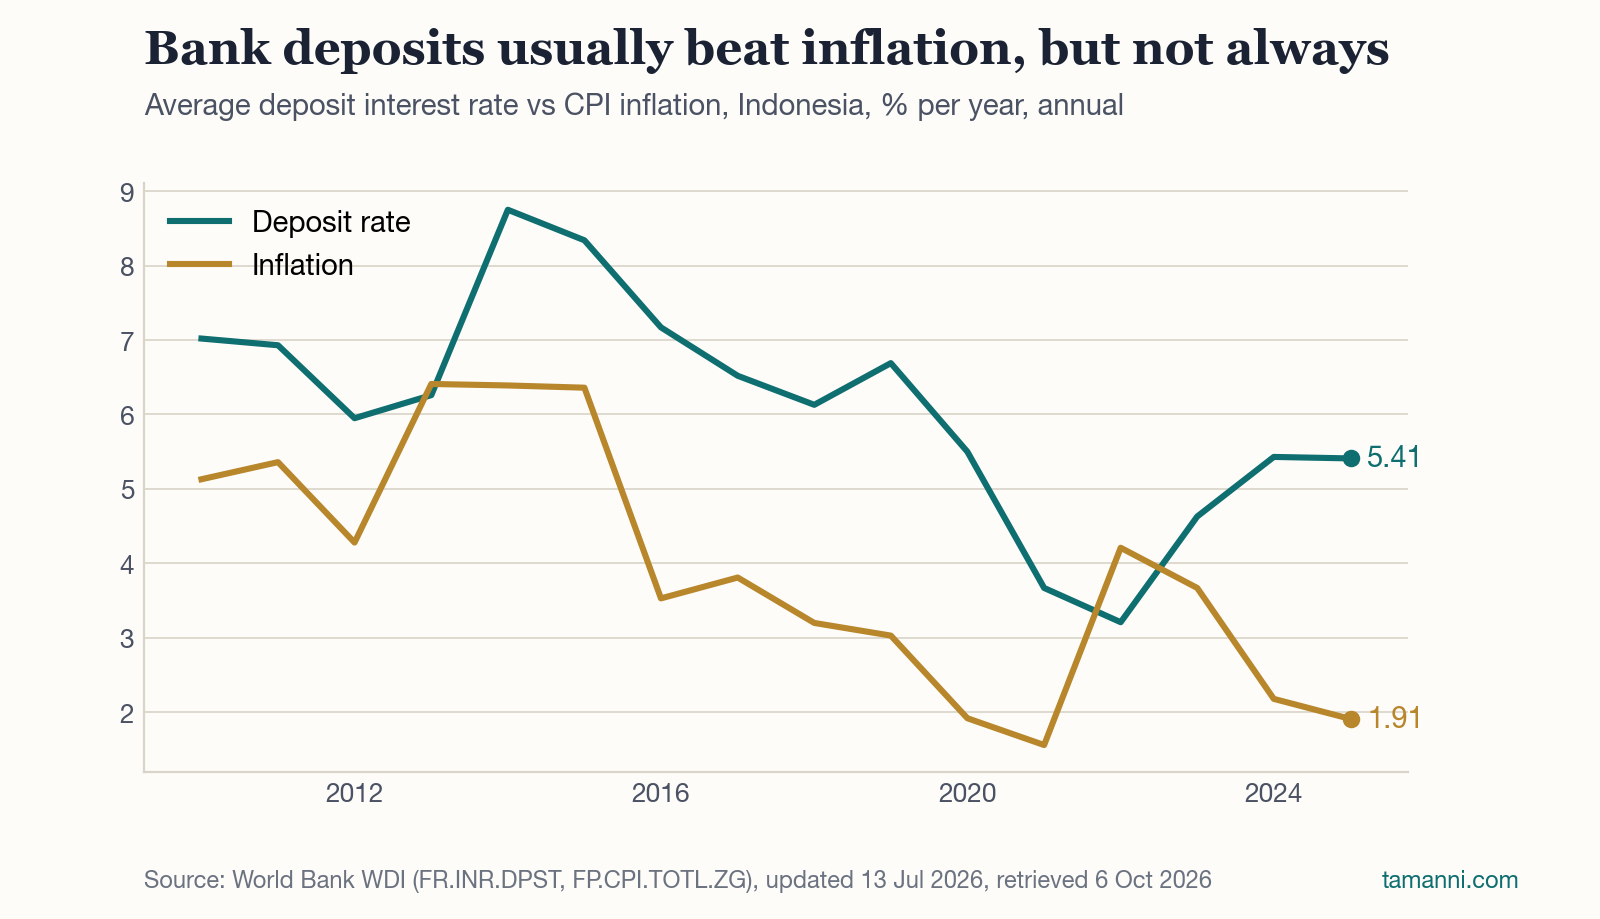
What happened. The average deposit rate in Indonesia was 5.4% in 2025, against inflation of 1.9%. That is a gap of 3.5 percentage points in the depositor’s favour. Over 16 years from 2010 to 2025, deposits beat inflation in 14. The two misses were 2013 (6.3% against 6.4%) and 2022 (3.2% against 4.2%).1
Why it matters. The gap between the two lines is the “real” return: what a saving earns once the rise in prices is taken out. Across 2016 to 2025 it averaged about 2.5 points a year (our own calculation from the series, rounded). As an illustration, Rp100 million at 5.4% grows to about Rp105.4 million in a year. If prices rise 1.9%, the same sum buys about 3.4% more than before. In 2022 the same account would have lost about 1% of buying power. Three cautions apply. The figure is a national average of reported rates, before tax and fees. For Islamic bank’s deposits, the equivalent rates for deposits usually around similar range, based on established empirical studies.
What it means for you
– Households: a cash goal with a short deadline, such as school fees or tarvel payment, has recently been protected from inflation, but that protection is not guaranteed in a year when prices jump.
– Business owners: idle cash earns a positive real return today, which sets a modest benchmark for any other use of that cash.
– Worth watching: the monthly BPS inflation release and Bank Indonesia’s policy-rate decisions, because the gap can narrow quickly if inflation rises before deposit rates adjust.
This article is for general information and education only. It is not investment, tax, legal or Sharia advice and does not consider your personal circumstances. Please consult a qualified adviser before making financial decisions.
- World Bank, World Development Indicators, “Deposit interest rate (%)”, Indonesia (FR.INR.DPST), and “Inflation, consumer prices (annual %)” (FP.CPI.TOTL.ZG), dataset last updated 13 Jul 2026, retrieved 6 Oct 2026. https://api.worldbank.org/v2/country/IDN/indicator/FR.INR.DPST and https://api.worldbank.org/v2/country/IDN/indicator/FP.CPI.TOTL.ZG. Annual averages; the deposit series is compiled from central bank and IMF data and is rounded to two decimals in our chart file. Earlier daily chart: “Prices in Indonesia rose about 33% in ten years” (5 Oct 2026). ↩
Editor’s note: This article was drafted with AI research assistance, before I began writing every article myself. Sources are cited above.
