Gross domestic savings reached 37.2% of Indonesia’s GDP in 2025, up from 32.8% in 2015. What a higher national saving rate does and does not say about households.
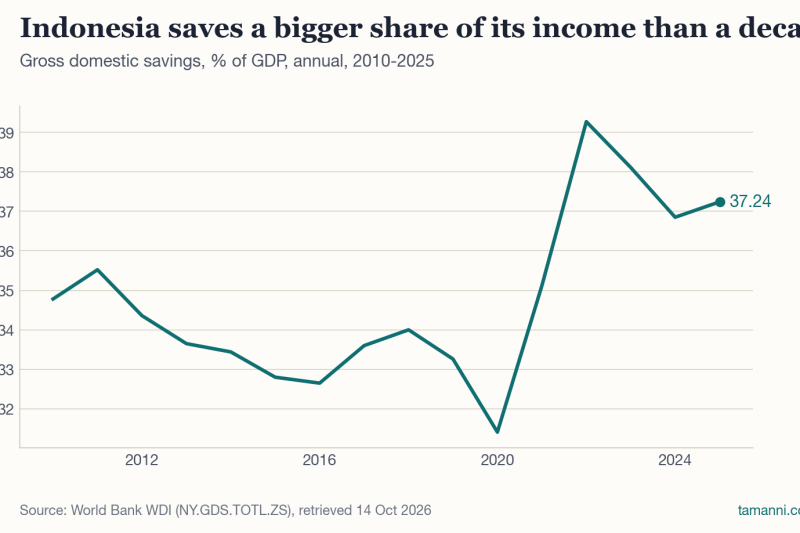
Gross domestic savings reached 37.2% of Indonesia’s GDP in 2025, up from 32.8% in 2015. What a higher national saving rate does and does not say about households.
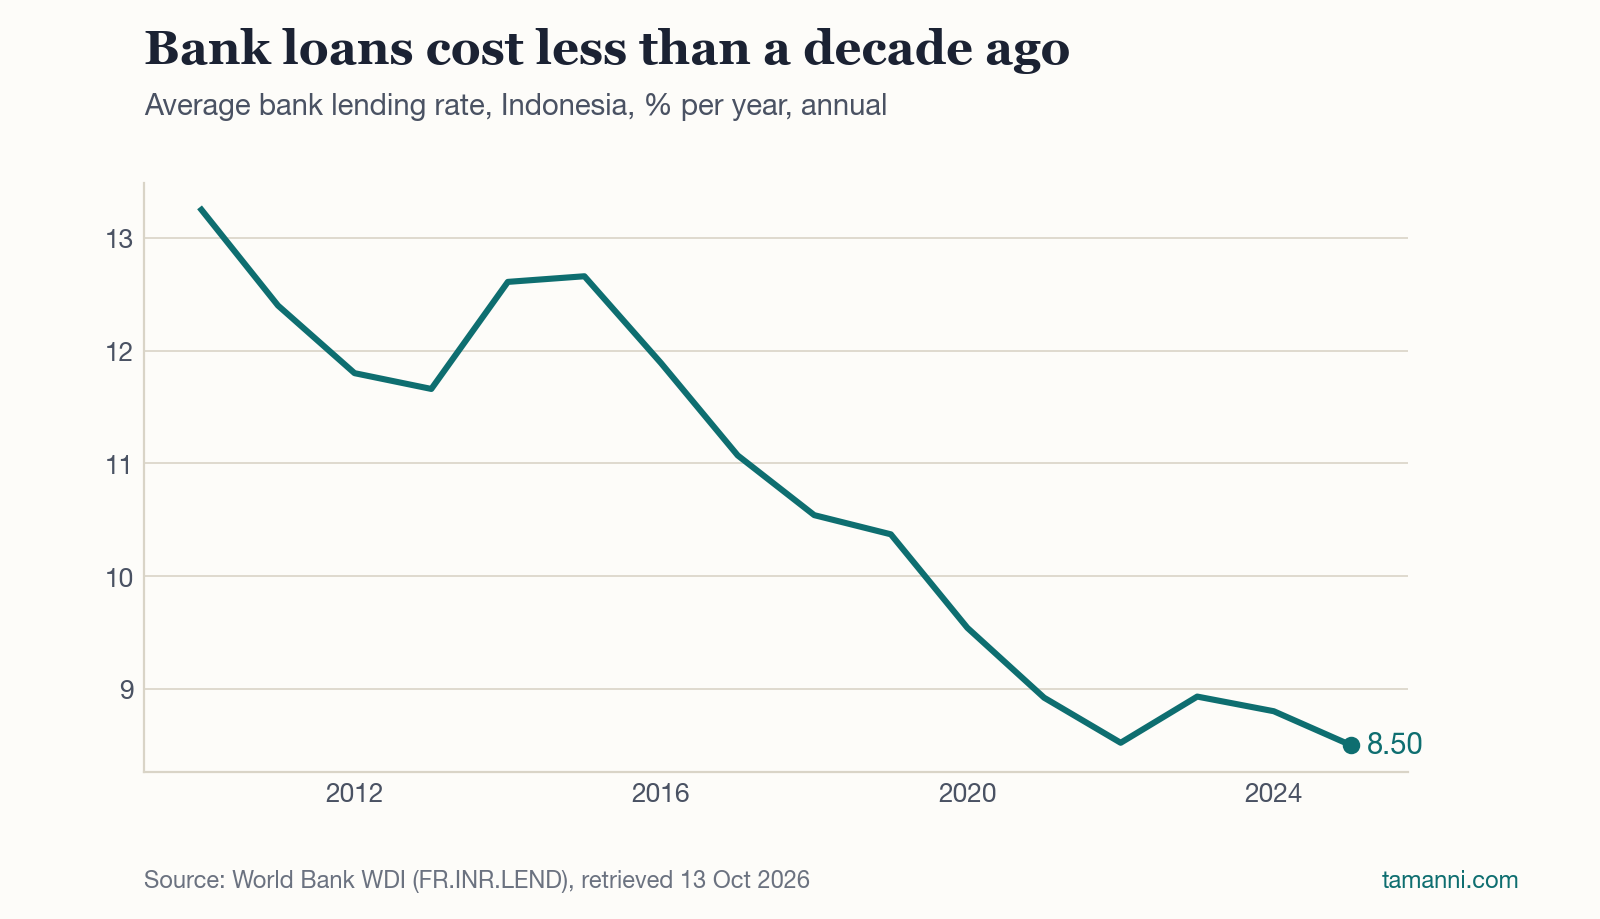
The average bank lending rate in Indonesia fell from 12.7% in 2015 to 8.5% in 2025. What cheaper borrowing means for home, vehicle and business financing.
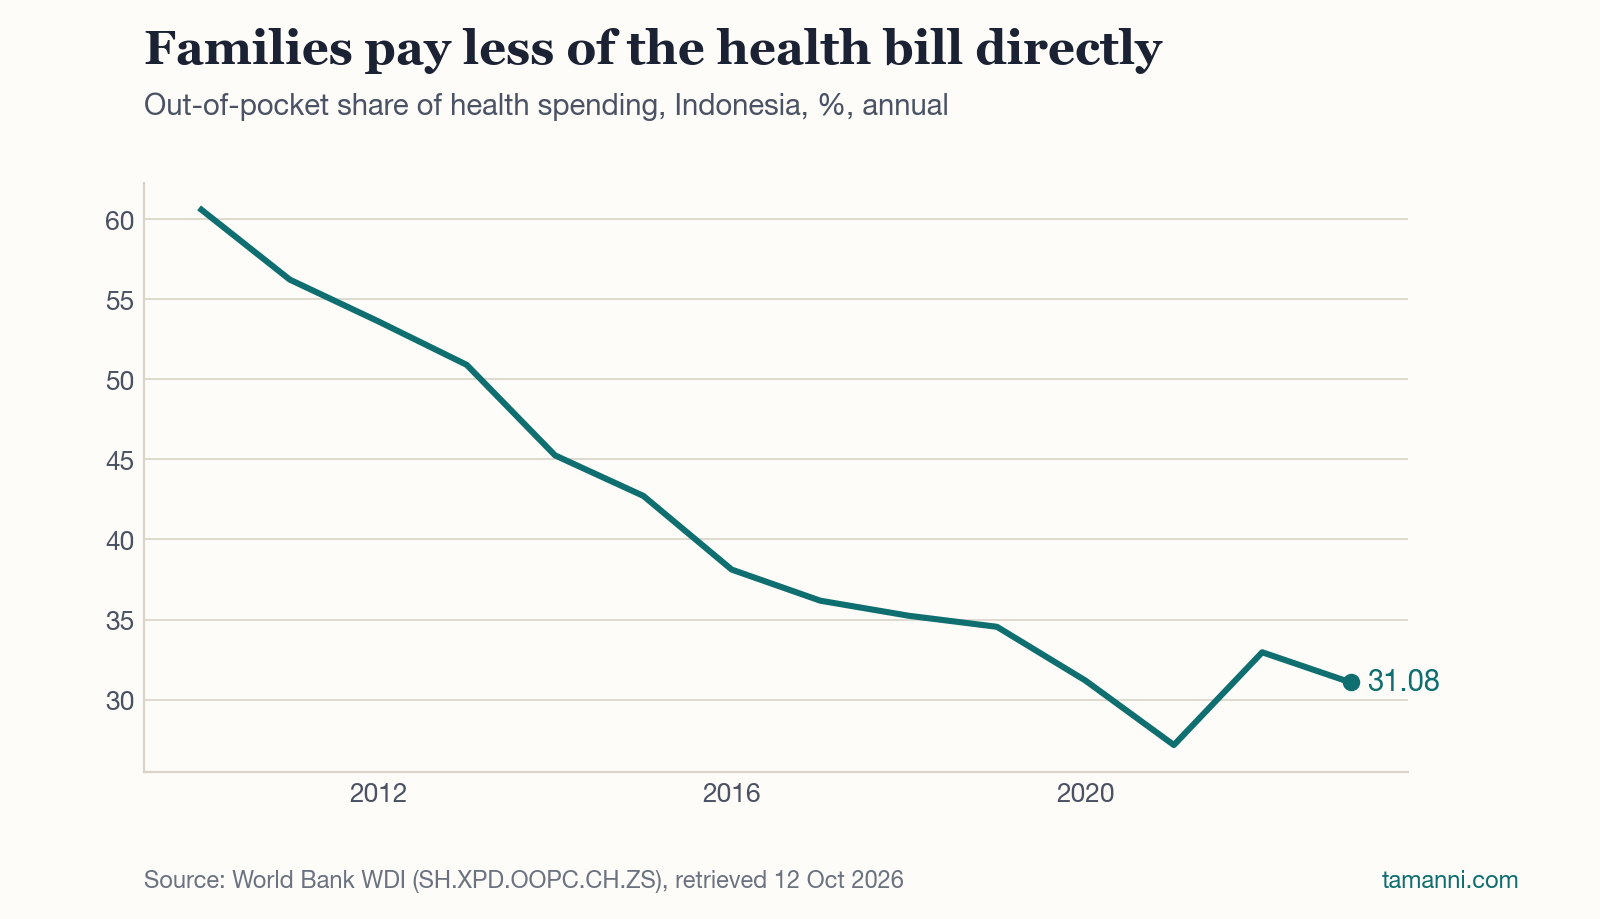
Out-of-pocket spending fell from 60.6% of Indonesia’s health bill in 2010 to 31.1% in 2023, but it rose in 2022. What that means for household cash buffers.
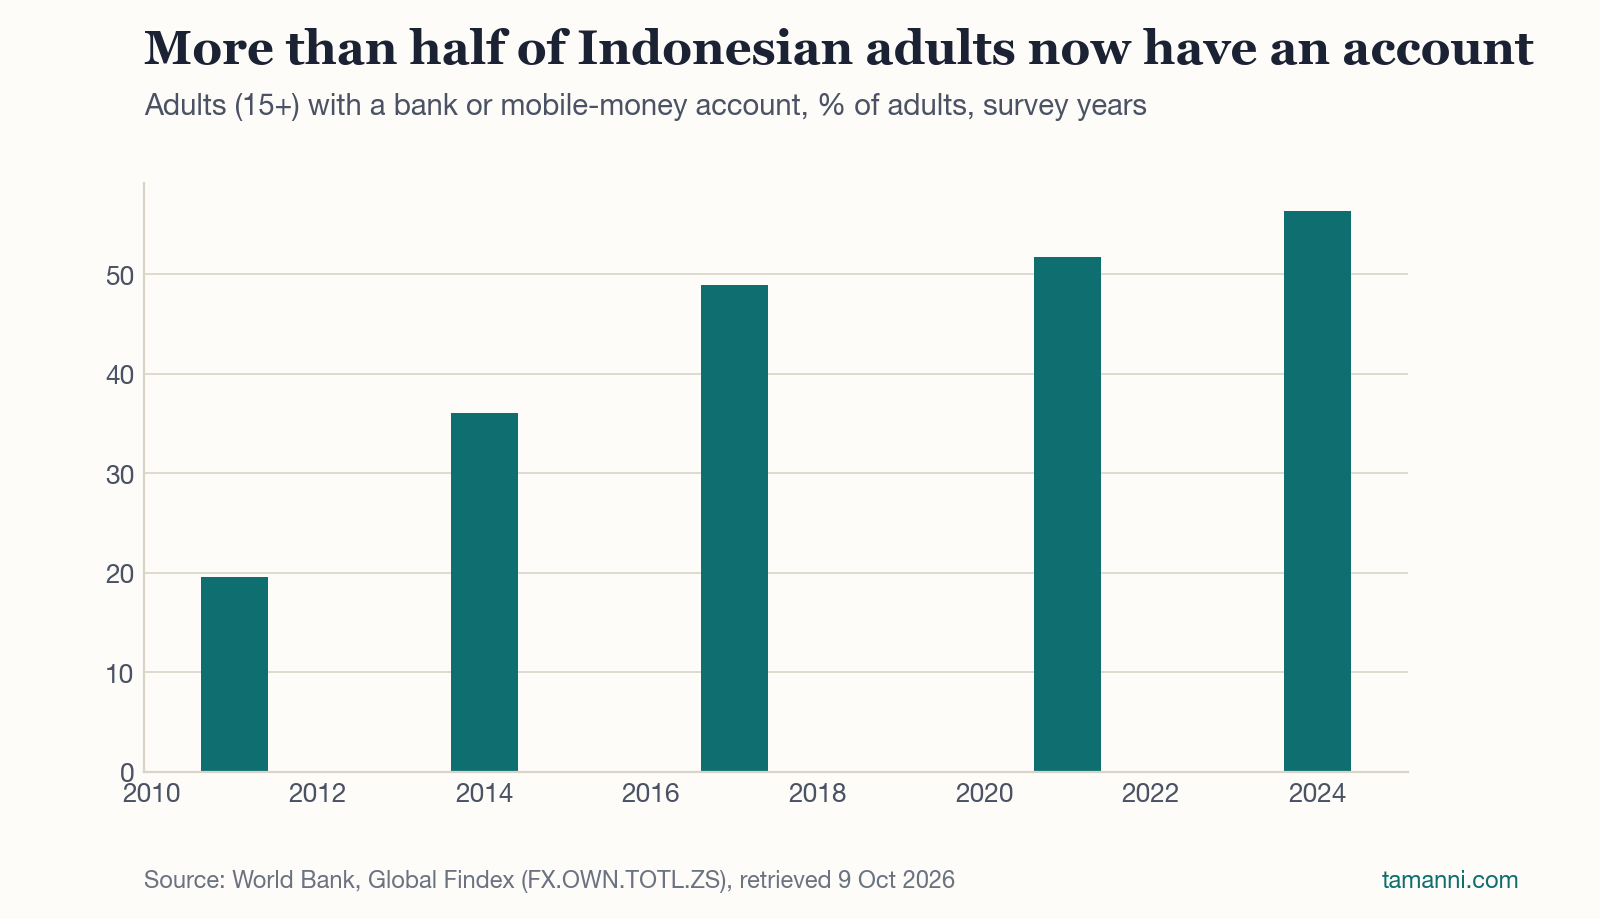
56% of Indonesian adults had a bank or mobile-money account in 2024, up from 20% in 2011. Growth has slowed since 2017. What that means for families.
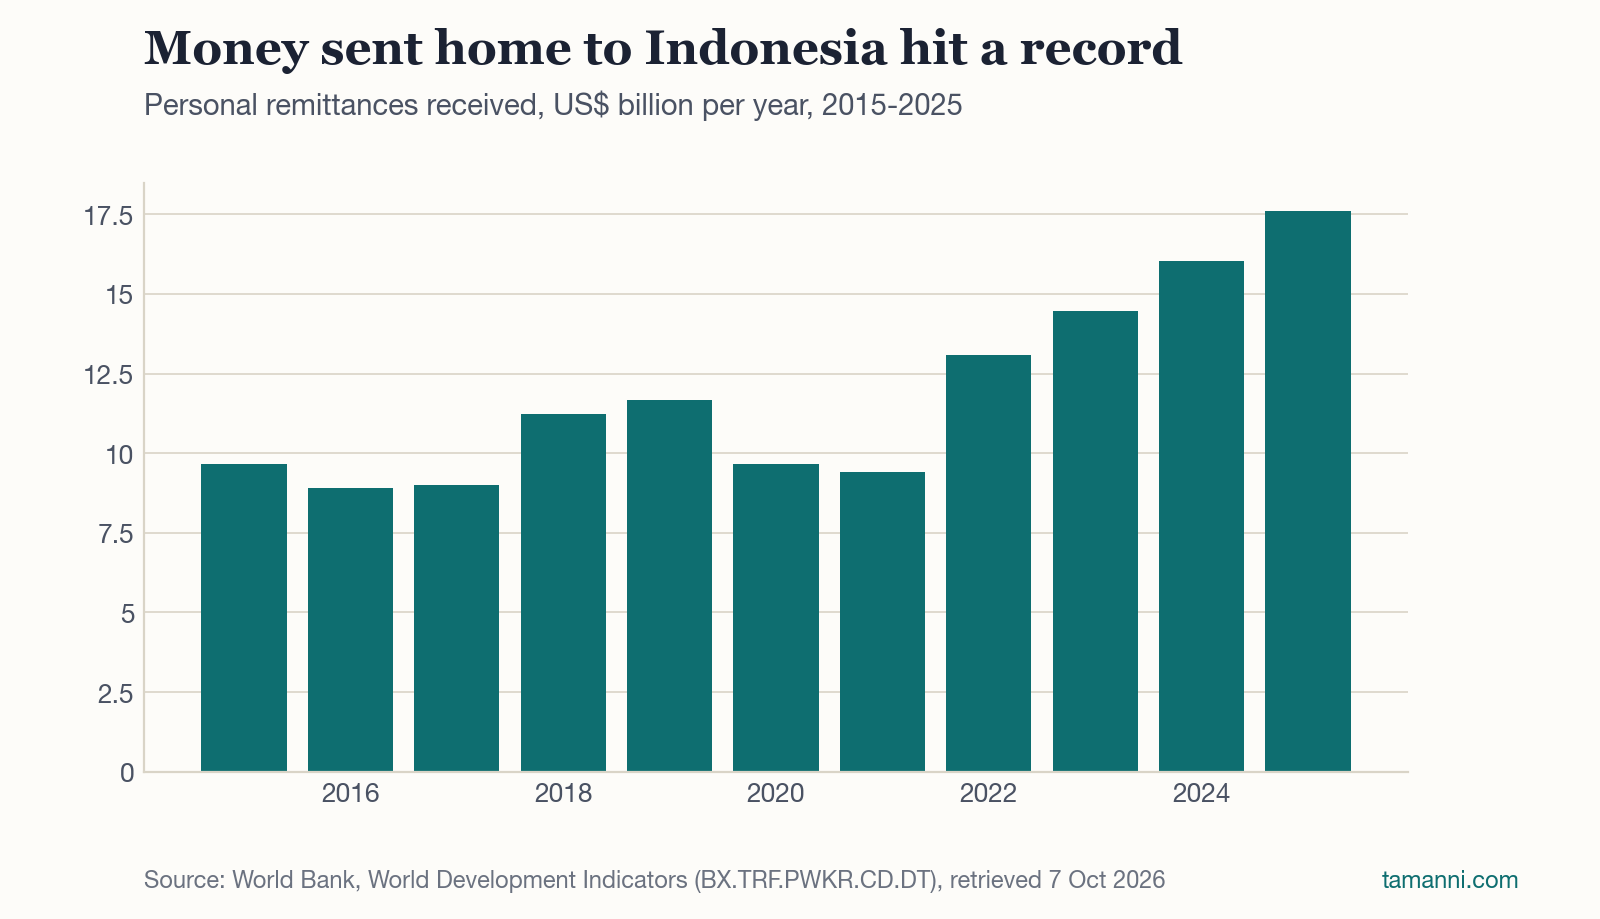
Money sent home to Indonesia reached US$17.6 billion in 2025, up from US$9.4 billion in 2021. What the rise means for families who send or receive support.
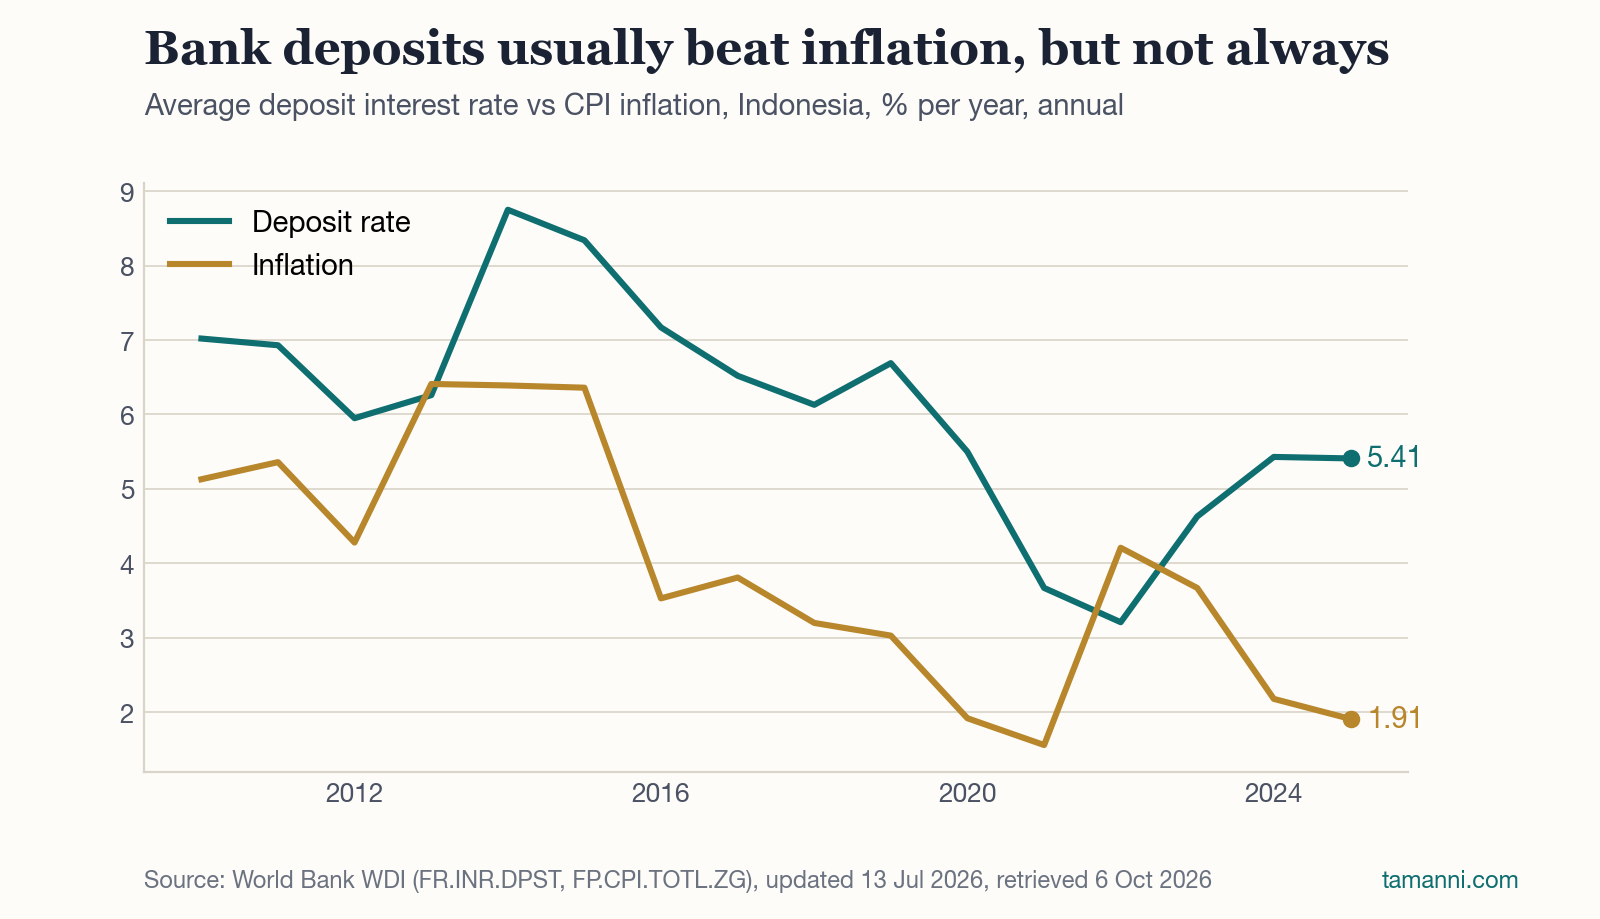
Average deposit rates in Indonesia beat inflation in 14 of the 16 years since 2010, by 3.5 points in 2025. In 2013 and 2022 they did not. What that means for savers.
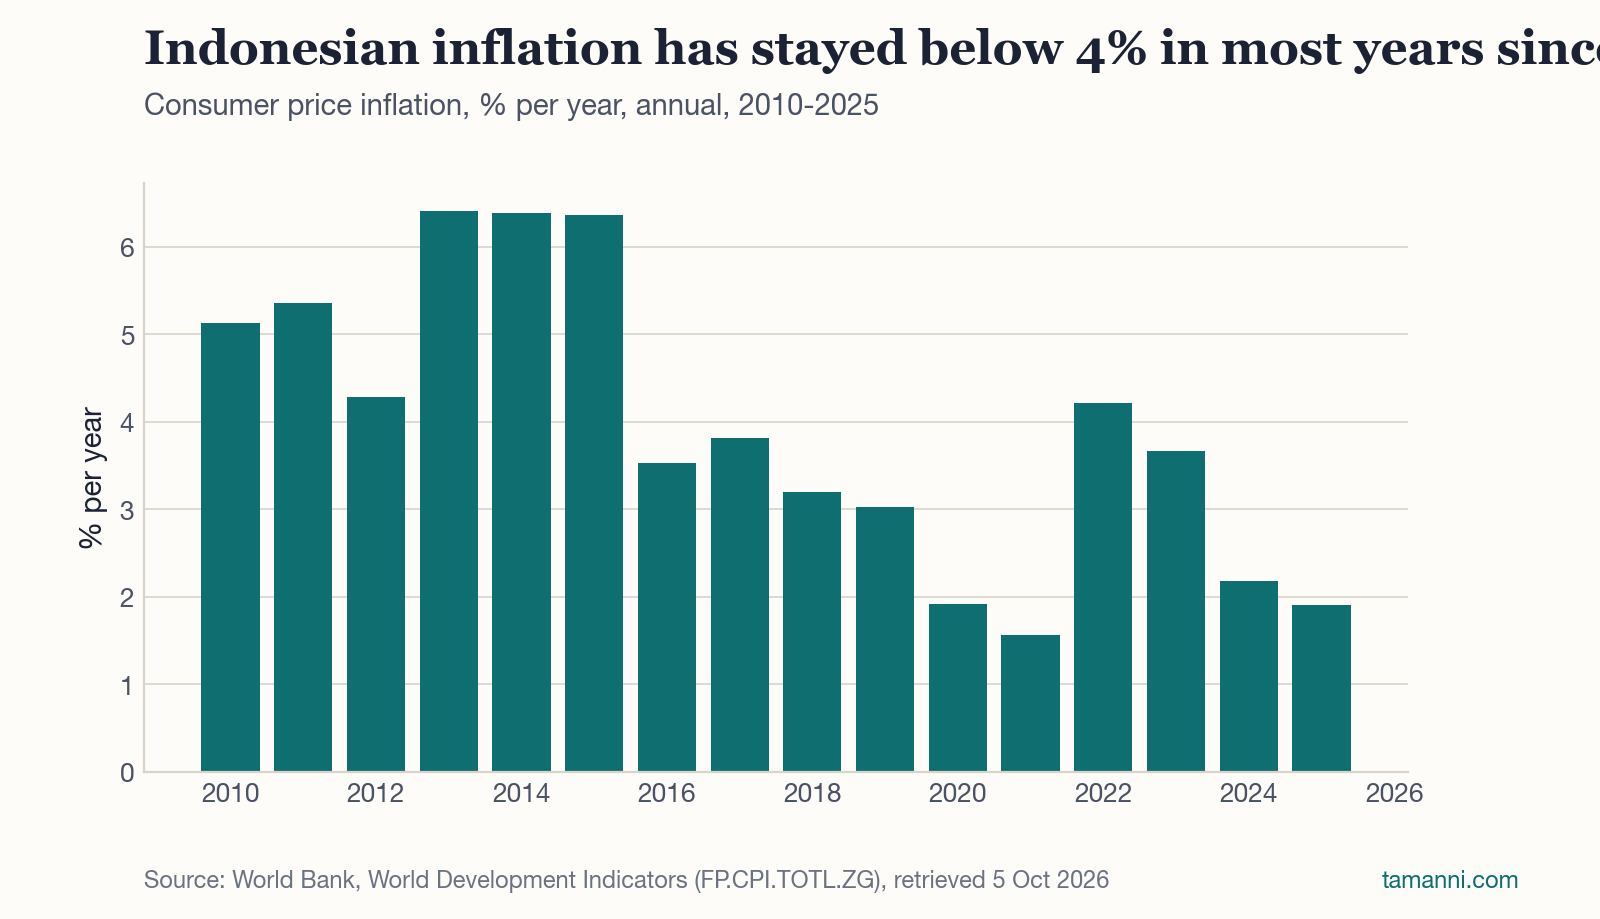
Indonesian inflation was below 4% in nine of the last ten years, yet prices still compounded to roughly 33% higher by 2025. What that means for savings and goals.
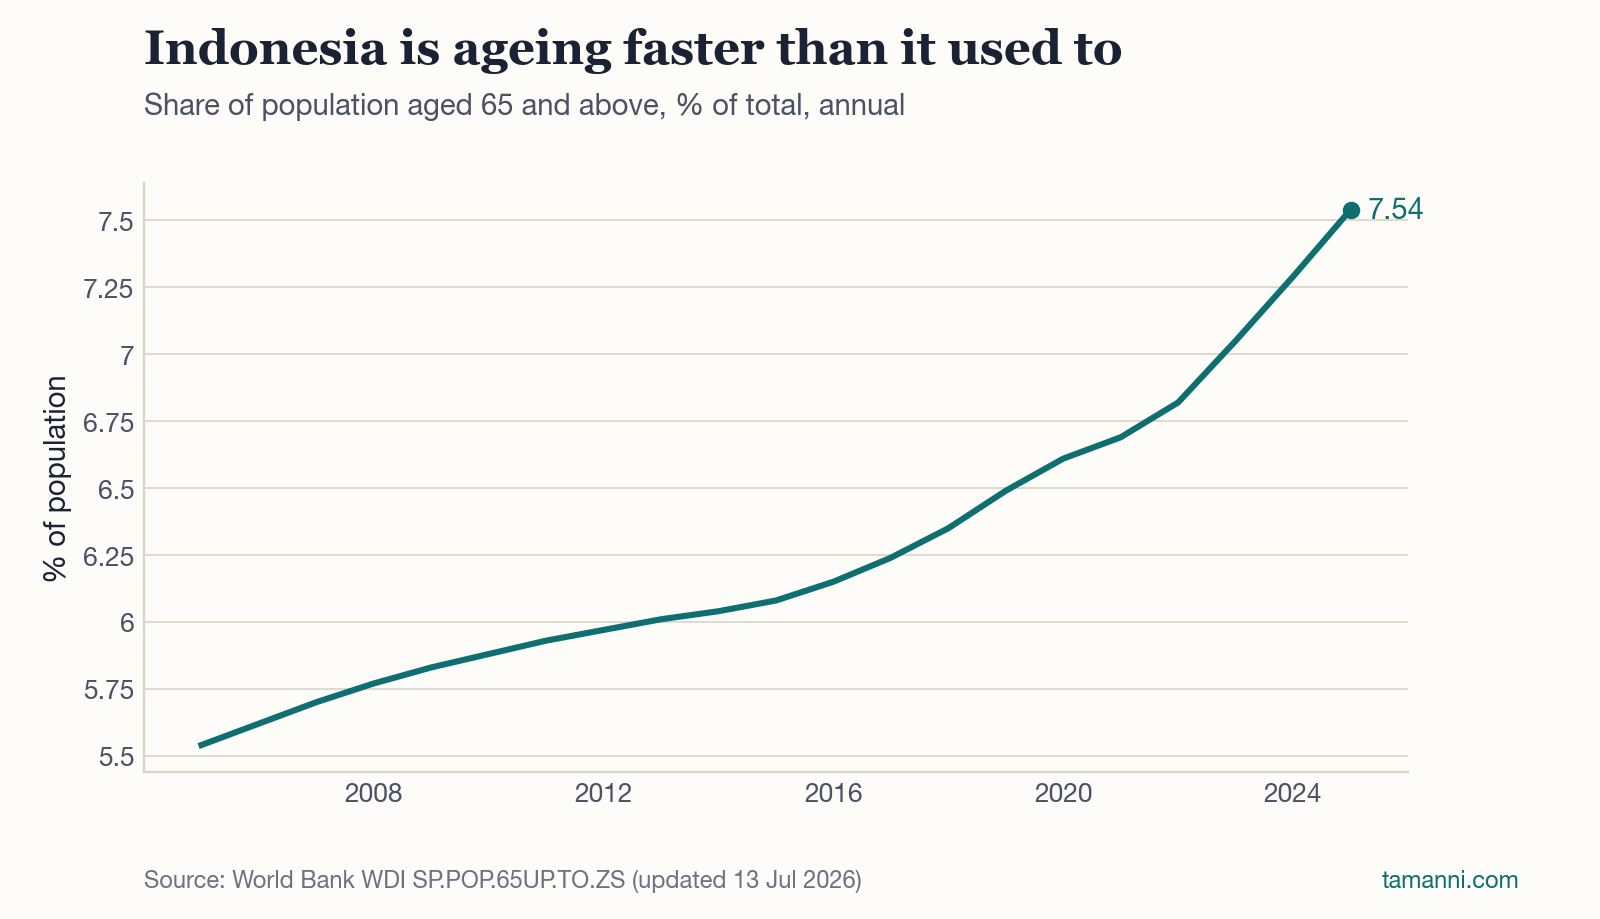
People aged 65 and over make up 7.5% of Indonesians, up from 6.1% in 2015. The pace has quickened, which matters for retirement saving and family support.
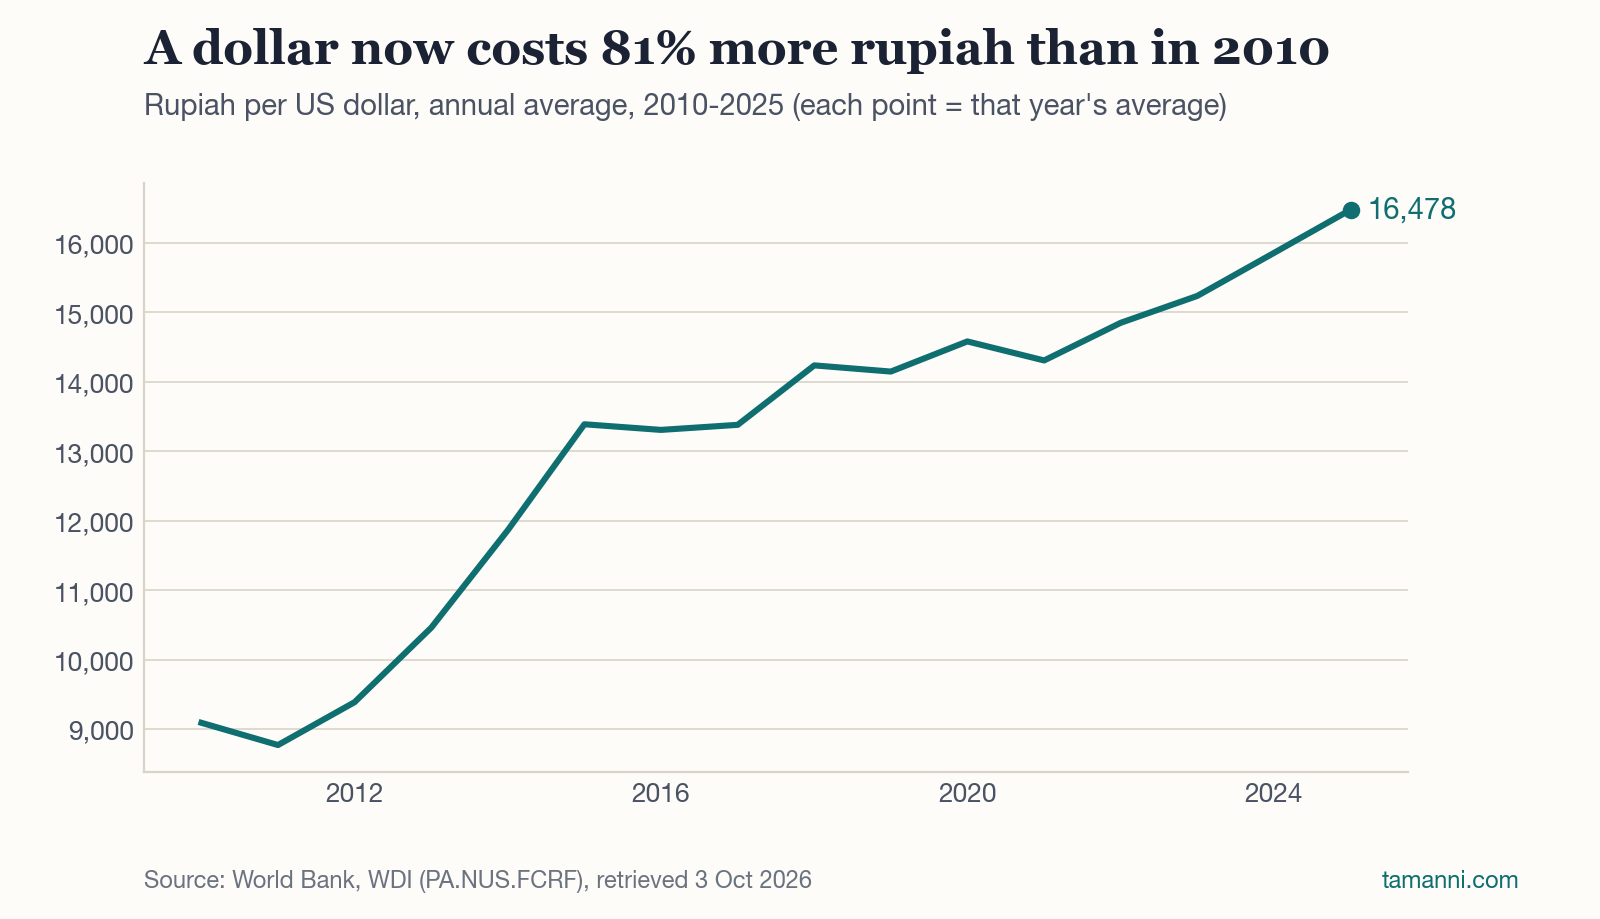
The dollar cost Rp9,090 in 2010 and Rp16,478 in 2025. For families paying overseas school fees or travelling, the slow rupiah depreciation adds up each year.
Home bias is well documented, but its cost depends on how correlated markets are. What the evidence shows, and does not show, for rupiah-based wealth.